A Singapore Government Agency WebsiteHow to identify
Official website links end with .gov.sg
Government agencies communicate via .gov.sg websites
(e.g. go.gov.sg/open).Trusted websites
Secure websites use HTTPS
Look for a lock ( )or https:// as an added precaution. Share sensitive information only on official, secure websites.
- About EMA
- Our Energy Story
- Consumer Information
- Regulations & Licences
- News & Events
- Partnerships


eSERVICES
Get quick access to EMA’s services for application of worker licences, scholarships and more.
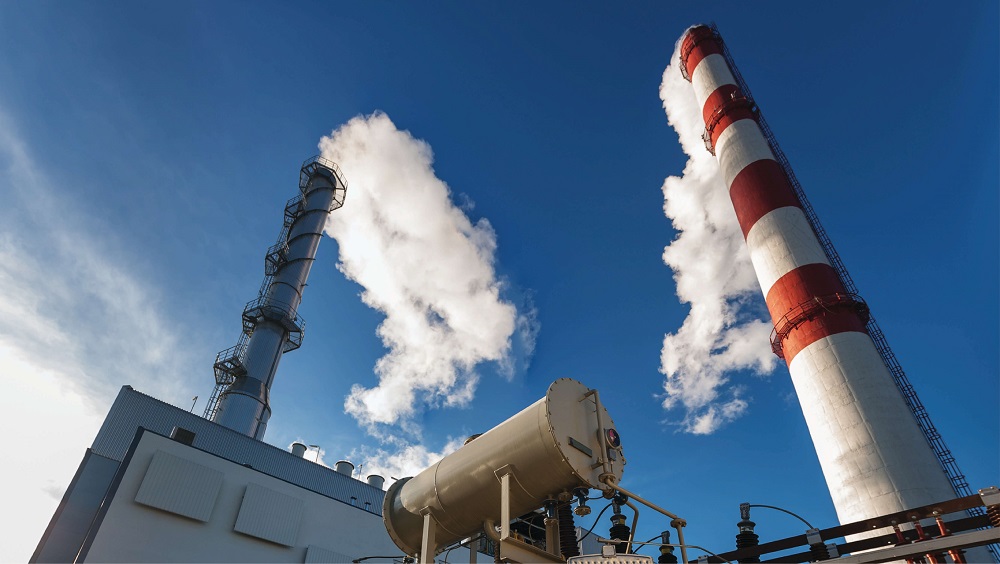
Electricity Generation
Total energy inputs required to generate gross electricity output in Singapore have been increasing since 2020, reflecting the growth in electricity demand. This was due to higher energy transformation activities after COVID-19 restrictions were lifted. In 2022, 10,054.5 ktoe (116.9 TWh) of energy inputs generated a gross electricity output of 4,910.8 ktoe (57.1 TWh).
As of Jun 2023, 5,038.1 ktoe (58.6 TWh) of energy inputs generated a gross electricity output of 2,428.2 ktoe (28.2 TWh).
Electricity Generation Input and Output
- 1H 2023
- 2022
- 2021
- 2020
- 2019
- 2018
- 2017


*Data for 2023 is as at Jun-2023.
Electricity Generation Industry
Generators Market Shares based on Electricity Generation
The market share distribution of the power generation market has remained relatively constant since 2016, with Tuas Power Generation, Senoko Energy, and YTL PowerSeraya accounting for more than half of the market share as of June 2023. Between 2021 and 2022, Tuas Power Generation's market share further increased from 18.9% to 22.0%, while YTL PowerSeraya's share increased from 13.2% to 13.9%.
As of Jun 2023, Tuas Power Generation held the largest market share (21.3%), followed by YTL PowerSeraya (15.6%) and Senoko Energy (15.4%).
Percentage Contribution to Total Electricity Generation (as at end period)
*Data for 2023 is as at Jun-2023.
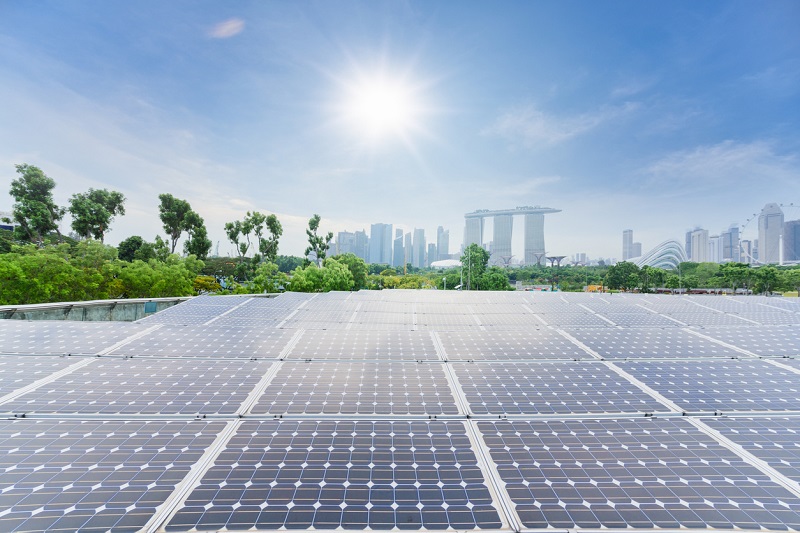
Electricity Generation Capacity by Technology Type
Singapore's electricity generation capacity increased from 12,179.1 MW in 2021 to 12,762.3 MW in 2022. This was largely due to increase in solar PV systems, Energy Storage System (ESS) and electricity import capacities.
In 2022, Combined Cycle Gas Turbine Co-Generation and Tri-Generation plants continued to account for the largest share of the total generation capacity at 82.2% (or 10,491.4 MW). The remainder comprised Steam Turbines (6.0% or 763.6 MW), Solar PVs (5.0% or 634.3 MWac), Waste-to-Energy (3.1% or 393 MW), new energy technologies such as Battery ESS (1.6% or 200 MW), and Electricity Imports (0.8% or 100 MW).
As of Jun 2023, the installed capacity of Solar PV Systems increased further to 773.9 MW.
Electricity Generation Capacity by Technology Type (as at end period)
*Data for 2023 is as at Jun-2023.
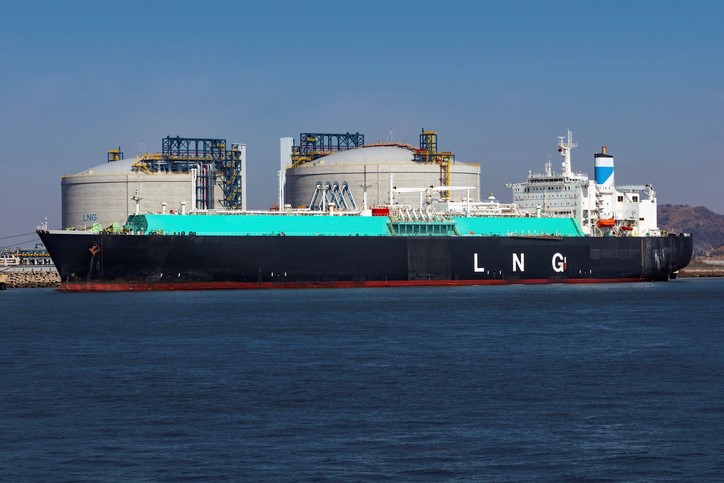
Fuel Mix for Electricity Generation
In 2022, Natural Gas accounted for 92.0% of Singapore’s fuel mix. Other energy products (e.g., Municipal Waste, Biomass and Solar) accounted for 4.4%, while the rest were contributed by Coal (1.0%) and Petroleum Products (2.6%).
Although the Natural Gas fuel mix in 2022 decreased due to tighter worldwide supply, it had since rebounded to represent 94.3% of the fuel mix in the first half of 2023. During the same period, Other Energy Products, Coal, and Petroleum products accounted for 4.4%, 0.9%, and 0.3% of the fuel mix, respectively.
Electricity Generation Fuel Mix
*Data for 2023 is as at Jun-2023.
Grid Emission Factor
The Operating Margin (OM) Grid Emission Factor (GEF) measures the average CO2 emissions emitted per unit of net electricity generation in the system by all grid-connected power units. The OM GEF includes generation technologies from main power producers (e.g. combined cycle power plants, waste-to-energy) and autoproducers* (e.g. embedded co-generation plants and solar).
The Build Margin (BM) Emission Factor refers to the average CO2 emissions emitted per unit of net electricity generation by the most recently built power units. Singapore’s BM emission factor trends lower than the OM emission factor as the most recently built power plants are generally more efficient as compared to the older plants.
Singapore’s average OM GEF rose slightly from 0.4085 kg CO2/kWh** in 2021 to 0.4168 kg CO2/kWh in 2022. This was largely due to an increase in diesel consumption as natural gas markets worldwide tightened in 2022.
*Refers to enterprises that produce electricity but for whom the production is not their principal activity.
** The historical 2021 OM GEF has been revised based on updated data from the licensees.
Grid Emission Factor
Energy Flows in the Oil Refining Sector
In 2021, a total of 43.7 Mtoe of refinery inputs (i.e. comprising 35.3 Mtoe of Crude Oil and Natural Gas Liquids and 8.4 Mtoe of Other Feedstocks) were utilised by the oil refining* sector, a 3.3% increase from 42.3 Mtoe in 2020. These inputs were used for the production of refined products by the oil refineries.
These inputs yielded an output of 42.9 Mtoe of petroleum products** in 2021, 3.6% higher than the output of 41.4 Mtoe in 2020. The output of petroleum products recorded for light distillates (10.2 Mtoe), middle distillates (19.0 Mtoe) and heavy distillates (13.7 Mtoe) were about 3.0%, 2.4% and 5.7% higher than their corresponding outputs in 2020.
*An oil refinery takes crude oil and separates it into different fractions. The refinery then converts those fractions into usable products. These products are finally blended to produce finished petroleum products (e.g. Gasoline, Naphtha, Jet Fuels and Fuel Oils) as outputs.
** Petroleum products can be classified under light distillates (e.g. LPG, Gasoline, Naphtha), middle distillates (e.g. Kerosene, Jet Fuel, Diesel), heavy distillates and residuum (e.g. heavy fuel oil, lubricating, wax).
Refinery Input and Output
- 2021
- 2020
- 2019
- 2018
- 2017


In This Chapter
Download
Data in this annual publication is accurate as of Sep 2023.
Share